LESSON 6
CANDLES
A Candlestick Chart is a popular type of chart used in financial markets, including forex, to represent price movements over a specified time period. Candlestick charts provide more information than traditional line charts and bar charts, offering insights into price action, market sentiment, and potential trend reversals. Here's an overview of how candlestick charts work:
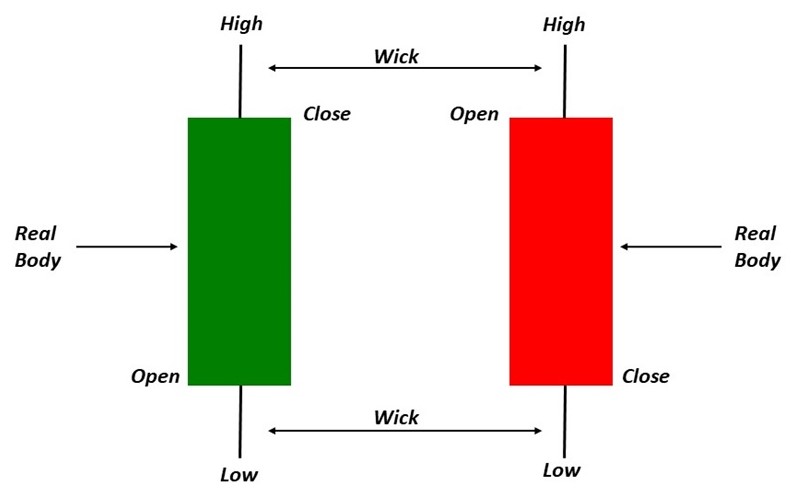
Components of a Candlestick:
-
Body: The rectangular area between the opening and closing prices for a given time period is called the body. It is typically colored or shaded to represent bullish (buyers dominated) or bearish (sellers dominated) market sentiment. If the closing price is higher than the opening price, the body is often colored green or white (bullish). If the closing price is lower than the opening price, the body is colored red or black (bearish).
-
Wicks or Shadows: The thin lines above and below the body, known as wicks or shadows, represent the highest and lowest prices reached during the time period. The upper wick extends from the top of the body to the high price, and the lower wick extends from the bottom of the body to the low price.
Reading a Candlestick Chart:
- The body of the candlestick represents the price range between the opening and closing prices.
- The wicks indicate the highest and lowest prices reached during the time period.
- The color of the body provides a visual cue about the market sentiment (bullish or bearish).
Basic Candlestick Patterns: Candlestick charts display different patterns that traders use to analyze price action. Here are some common candlestick patterns:
Doji:
Doji pattern is a price action candlestick pattern of indecision that is formed when the opening and closing prices are almost equal.
It is formed when both the bulls and bears are fighting to control prices but nobody succeeds in gaining full control of the prices.
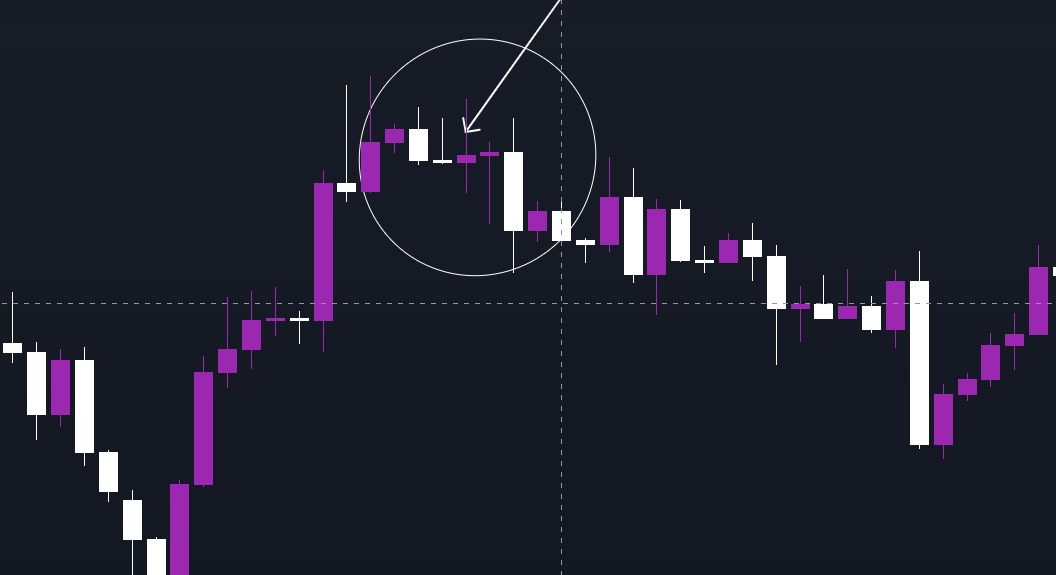
A Doji is a candlestick pattern that occurs when the opening and closing prices are very close to each other, resulting in a small or non-existent body. Here are key characteristics of a Doji:
-
Small or Non-existent Body:
- The body of the Doji is very small or, in some cases, non-existent. The opening and closing prices are nearly equal, creating a horizontal line.
-
Long Upper and Lower Wicks:
- A Doji typically has long upper and lower wicks, indicating that prices fluctuated significantly during the trading period.
-
Indicates Market Indecision:
- The Doji pattern suggests a state of indecision in the market between buyers and sellers. Neither bulls nor bears have taken control, resulting in a standoff.
-
Potential Reversal Signal:
- While a single Doji on its own may not provide a strong signal, when it occurs after a trend (either uptrend or downtrend), it can signal potential reversal. For example:
- Doji After Uptrend: A Doji after a series of rising candles may indicate that buyers are losing momentum, and a reversal could be imminent.
- Doji After Downtrend: A Doji after a series of falling candles may suggest that sellers are losing control, and a reversal to the upside could occur.
- While a single Doji on its own may not provide a strong signal, when it occurs after a trend (either uptrend or downtrend), it can signal potential reversal. For example:
-
Confirmation Needed:
- Traders often wait for confirmation in the form of additional price action after a Doji to determine the direction of the potential reversal. This could involve waiting for the next candlestick to confirm a continuation or reversal pattern.
Spinning Top
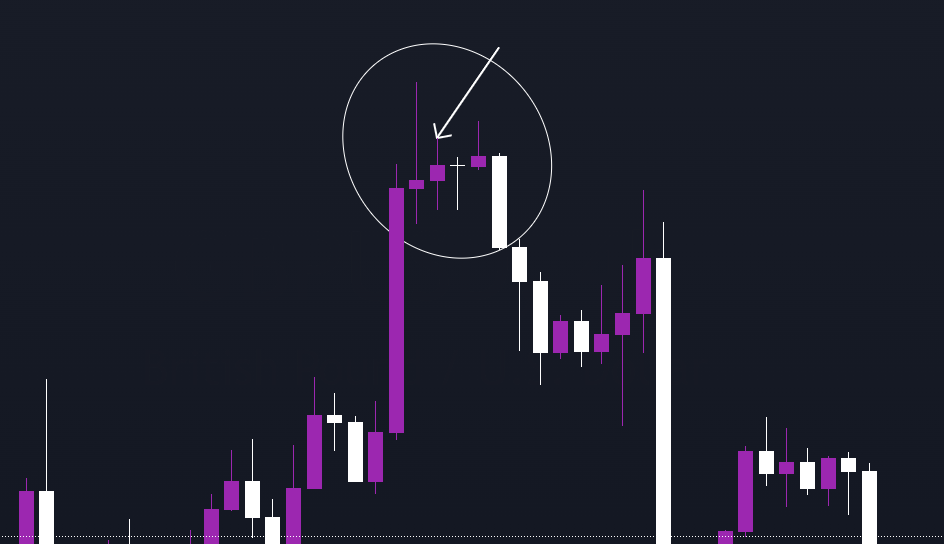
The Spinning Top is indeed a candlestick pattern that indicates indecision in the market, similar to the Doji. Here are the correct characteristics:
-
Small Real Body:
- The Spinning Top has a small real body (the difference between the opening and closing prices), which can be either bullish or bearish.
-
Long Upper and Lower Wicks:
- What distinguishes the Spinning Top is that it has long upper and lower wicks, indicating that prices fluctuated significantly during the trading session.
-
Indicates Indecision:
- The presence of both upper and lower wicks suggests a battle between buyers and sellers. Despite some price movement, neither group has gained control, resulting in a state of indecision.
-
Formation Differences from Doji:
- Unlike the Doji, which has little to no body, the Spinning Top may have a small body that is larger than that of a Doji. The key feature is the significant presence of wicks on both ends.
-
Context is Important:
- The Spinning Top is often considered more significant when it occurs after a trend, signaling potential exhaustion and a reversal or a period of consolidation.
While both the Doji and Spinning Top convey a sense of market indecision, the Spinning Top's larger real body suggests slightly more activity during the trading session. As with any candlestick pattern, traders should consider the overall market context and use additional indicators or patterns for confirmation before making trading decisions.
Shooting Star
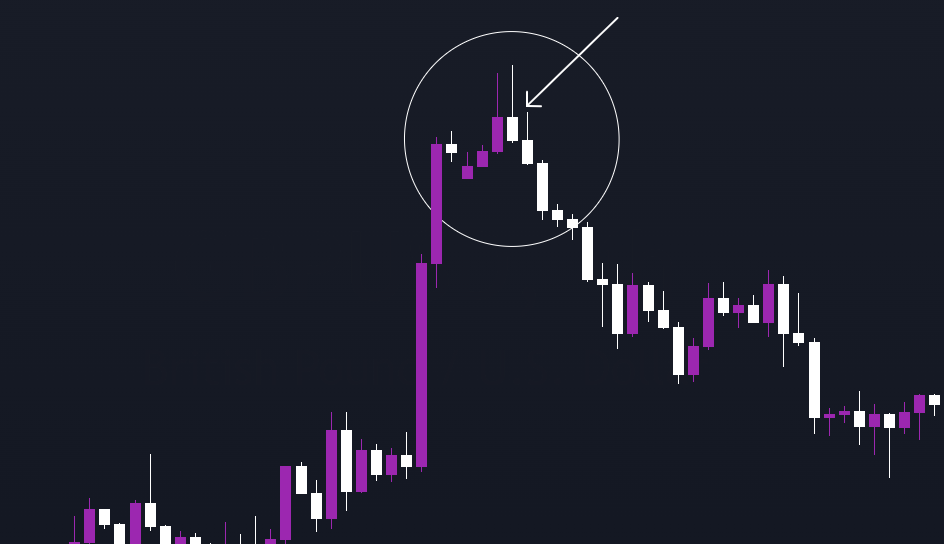
A Shooting Star is a candlestick pattern that typically forms after an uptrend and is considered a potential bearish reversal signal. Here are the correct characteristics:
-
Small Body at the Top:
- The Shooting Star has a small real body (the difference between the opening and closing prices) near the bottom of the candlestick, which is typically colored to represent a bearish day.
-
Long Upper Wick:
- The most distinctive feature of a Shooting Star is its long upper wick, extending from the top of the body. This upper wick represents the distance between the high price and the closing price.
-
Little to No Lower Wick:
- The lower wick, if present, is usually short or nonexistent, indicating that the closing price is close to the low of the session.
-
Indicates Potential Bearish Reversal:
- The Shooting Star suggests that, despite the upward momentum during the session, sellers came into the market, pushing the price back down. This sudden shift from bullish to bearish sentiment can indicate a potential reversal.
-
Confirmation Needed:
- Traders often wait for confirmation in the form of a follow-up candlestick. If the next candlestick supports the bearish reversal, it adds credibility to the Shooting Star pattern.
It's crucial to consider the context of the market and use additional technical analysis tools to confirm the potential reversal signaled by a Shooting Star. As with any candlestick pattern, false signals can occur, and traders should exercise caution and consider multiple factors before making trading decisions.
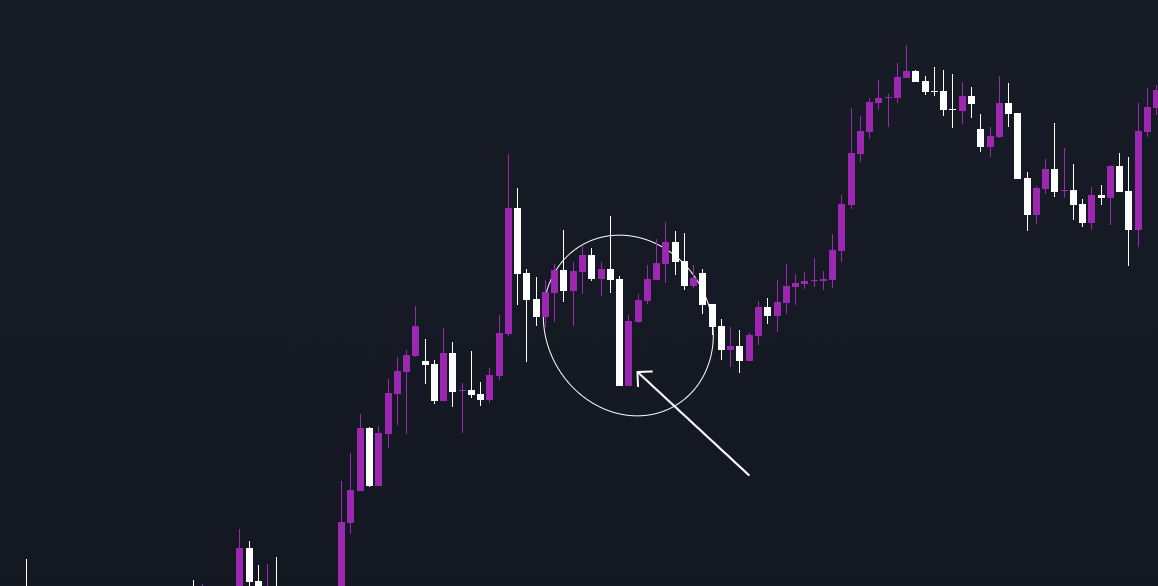
White Marubozu
A White Marubozu is a single candlestick pattern with a long white or green body that has no upper or lower wick. The high and low prices for the session are equal to the open or close, and the body represents a strong bullish day.
-
Formation:
- The White Marubozu forms after a downtrend, indicating a potential shift in sentiment from bearish to bullish.
-
No Upper or Lower Wick:
- What distinguishes the White Marubozu is the absence of both upper and lower wicks. The open price is at the bottom of the body, and the close is at the top.
-
Bullish Reversal Signal:
- The absence of upper and lower wicks suggests that buyers dominated the entire trading session, pushing prices higher. This dominance is often interpreted as a strong bullish reversal signal.
-
Implications for Traders:
- Traders may view the White Marubozu as a sign that buyers are in control, and there is potential for a continued bullish movement. It can be seen as a shift in momentum from bearish to bullish.
-
Consideration of Volume:
- Some traders consider volume along with the White Marubozu. A strong bullish reversal with high volume adds confirmation to the pattern.
It's important for traders to consider the White Marubozu in the context of the overall market trend and use additional technical analysis tools for confirmation. While it signals a potential bullish reversal, like any pattern, it's not foolproof, and false signals can occur.
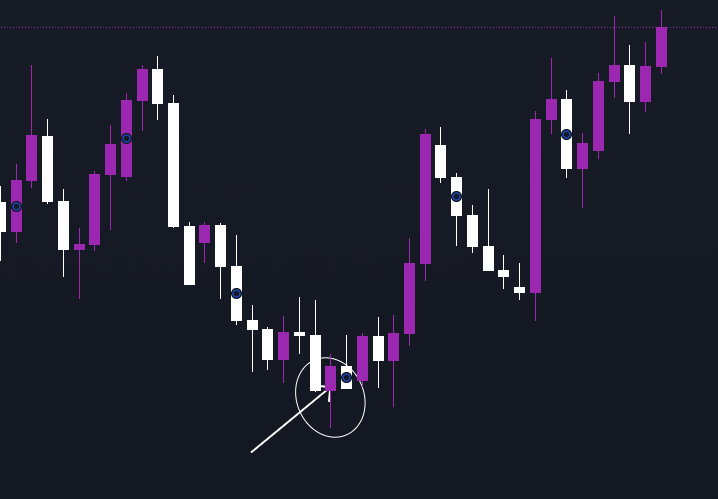
Hammer pattern
The hammer pattern occurs on a candlestick chart when the trades are significantly lower than the opening, but will rally within that time period to close near the opening price.
A hammer-shaped candlestick forms when the lower shadow is around twice the size of the body, where the body of the candle represents the difference between open and close prices, and the wick highlights the high and low prices of the time period.
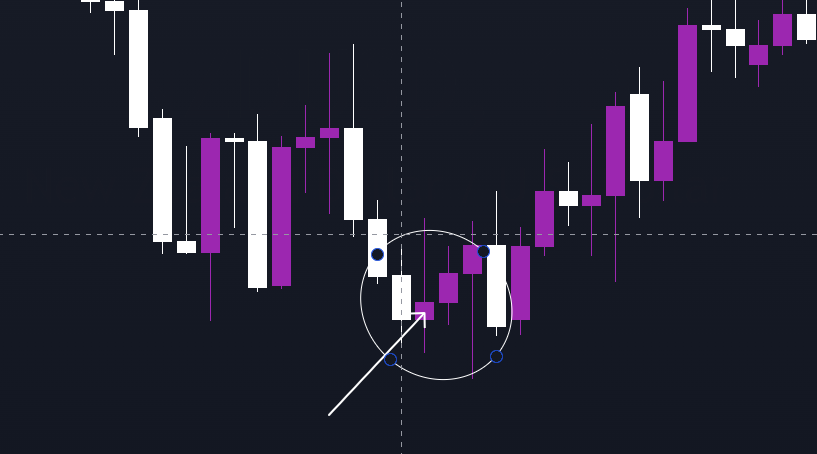
Inverse hammer pattern
The inverse hammer or inverted hammer candlestick pattern can appear on a chart at the bottom of a downtrend, which could signal a bullish reversal. Similar to the hammer pattern, its shape is upside down and is identified with a long upper shadow, a short lower shadow, and a tiny candle body.
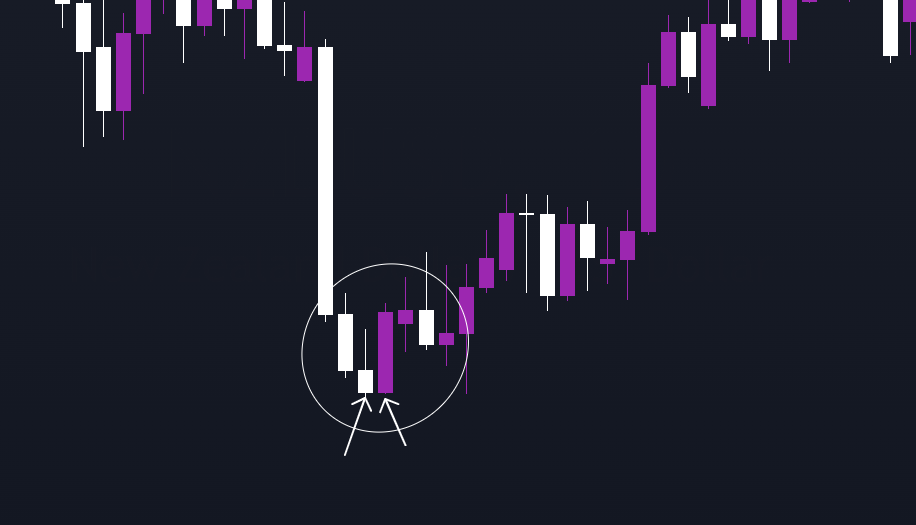
Bullish Engulfing:
Bullish Engulfing is a multiple candlestick chart pattern that is formed after a downtrend indicating a bullish reversal.
It is formed by two candles, the second candlestick engulfing the first candlestick. The first candle is a bearish candle that indicates the continuation of the downtrend.
The second candlestick is a long bullish candle that completely engulfs the first candle and shows that the bulls are back in the market.
Bearish Engulfing:
Bearish Engulfing is a multiple candlestick pattern that is formed after an uptrend indicating a bearish reversal.
It is formed by two candles, the second candlestick engulfing the first candlestick. The first candle being a bullish candle indicates the continuation of the uptrend.
The second candlestick chart is a long bearish candle that completely engulfs the first candle and shows that the bears are back in the market.
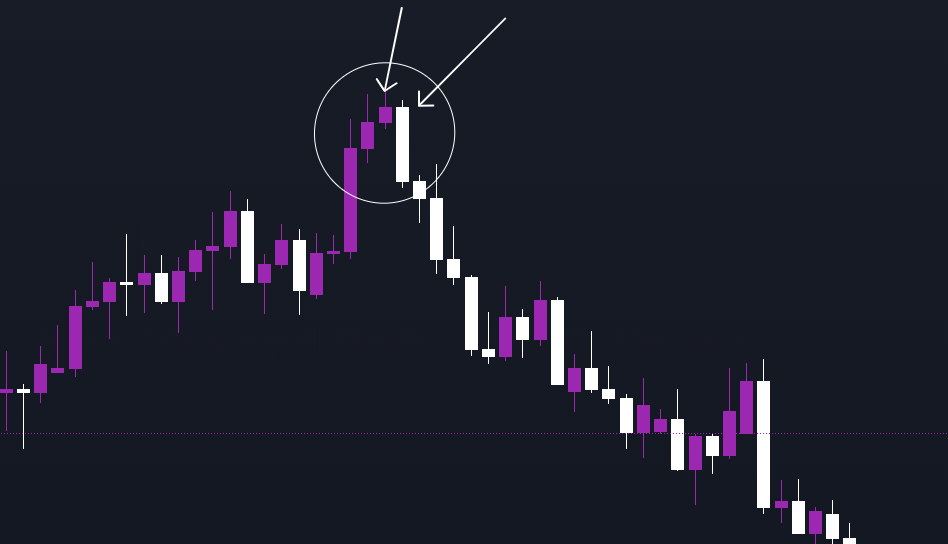
Bullish Harami:
The Bullish Harami is multiple candlestick chart pattern which is formed after a downtrend indicating bullish reversal.
It consists of two candlestick charts, the first candlestick being a tall bearish candle and second being a small bullish candle which should be in the range of the first candlestick.
The first bearish candle shows the continuation of the bearish trend and the second candle shows that the bulls are back in the market.
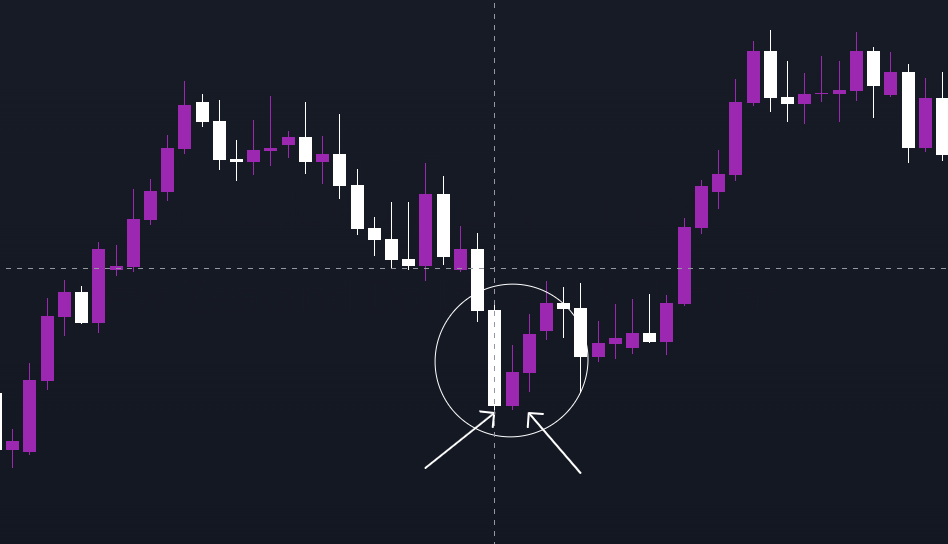
Bearish Harami:
The Bearish Harami is a multiple candlestick pattern formed after the uptrend indicating bearish reversal.
It consists of two candlesticks, the first candlestick being a tall bullish candle and second being a small bearish candle which should be in the range of the first candlestick chart.
The first bullish candle shows the continuation of the bullish trend and the second candle shows that the bears are back in the market.
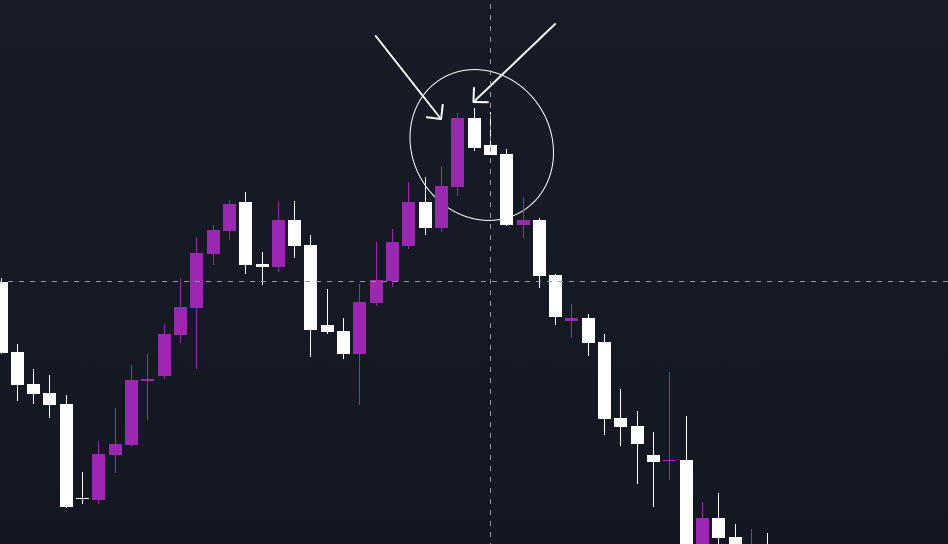
Tweezer Bottom:
The Tweezer Bottom candlestick pattern is a bullish reversal candlestick pattern that is formed at the end of the downtrend.
It consists of two candlesticks, the first one being bearish and the second one being bullish candlestick.
Both the candlesticks make almost or the same low.When the Tweezer Bottom candlestick pattern is formed the prior trend is a downtrend.
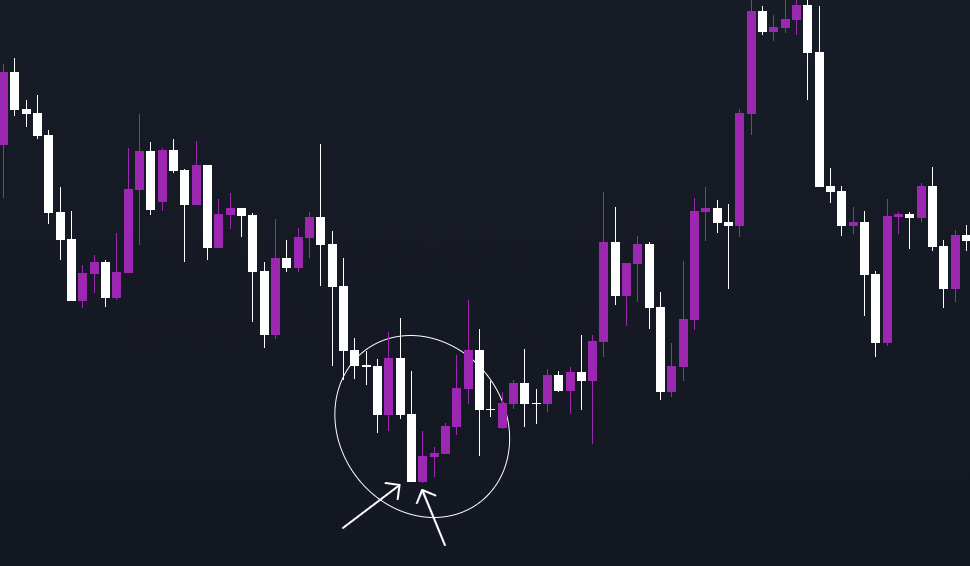
A bearish tweezer candlestick is formed, which looks like the continuation of the ongoing downtrend. The bullish candle’s low indicates a support level.
The bottom-most candles with almost the same low indicate the strength of the support and also signal that the downtrend may get reversed to form an uptrend. Due to this, the bulls step into action and move the price upwards.
This bullish reversal is confirmed the bullish candle is formed.
Tweezer Top:
The Tweezer Top pattern is a bearish reversal candlestick pattern that is formed at the end of an uptrend.
It consists of two candlesticks, the first one being bullish and the second one being bearish candlestick. Both the tweezer candlesticks are almost or the same height.
When the Tweezer Top candlestick pattern is formed, the prior trend is an uptrend. A bullish candlestick is formed, which looks like the continuation of the ongoing uptrend.
The second bearish candle’s high indicates a resistance level. Bulls seem to raise the price upward, but now they are not willing to buy at higher prices.
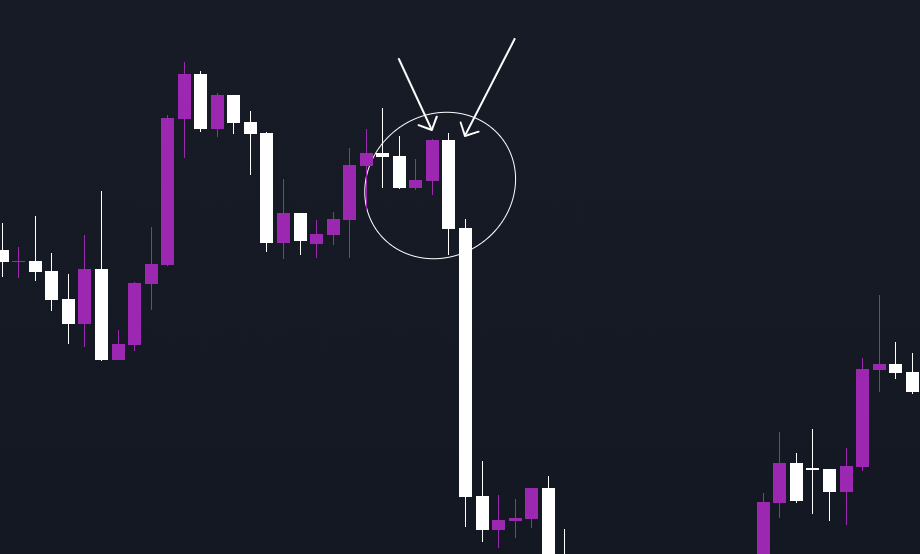
The top-most candles with almost the same high indicate the strength of the resistance and also signal that the uptrend may get reversed to form a downtrend. This bearish reversal is confirmed when the bearish candle is formed.

Candlestick charts are valuable for technical analysis, allowing traders to identify trends, reversals, and potential entry or exit points. Traders often use candlestick patterns in conjunction with other technical analysis tools for more comprehensive decision-making in the forex market.
Black Marubozu
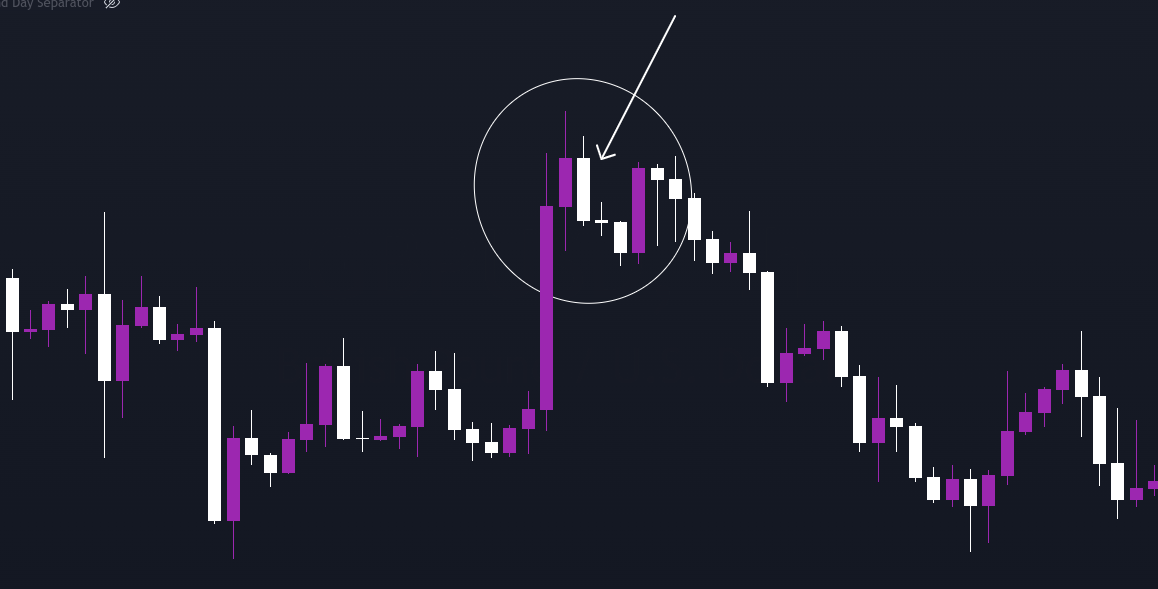
A Black Marubozu is a single candlestick pattern that signifies a bearish continuation when it appears after an uptrend. Here are the key characteristics and implications of a Black Marubozu:
-
Definition:
- A Black Marubozu is a single candlestick pattern with a long black or red body that has no upper or lower wick. The open and close prices are at the low of the session, indicating strong bearish sentiment.
-
Formation:
- The Black Marubozu forms after an uptrend, suggesting a continuation of the existing bearish momentum.
-
No Upper or Lower Wick:
- Similar to the White Marubozu, the Black Marubozu has no upper or lower wick. The open and close prices are at the lowest point of the session.
-
Bearish Continuation Signal:
- The absence of upper and lower wicks suggests that sellers dominated the entire trading session, pushing prices lower. This dominance is interpreted as a strong bearish continuation signal.
-
Implications for Traders:
- Traders may view the Black Marubozu as a sign that sellers are in control, and there is potential for a continued bearish movement. It can be seen as a confirmation of the existing downtrend.
-
Consideration of Volume:
- Like with the White Marubozu, some traders consider volume along with the Black Marubozu. A strong bearish continuation with high volume adds confirmation to the pattern.
It's important to note that while the Black Marubozu suggests a bearish continuation, traders should consider it in the context of the overall market trend and use additional technical analysis tools for confirmation. As with any candlestick pattern, false signals can occur, and risk management is crucial.
The Morning Star:
-
-
The Morning Star is indeed a multiple candlestick pattern that signals a potential bullish reversal after a downtrend. Here's how it typically forms:
- First Candle: The pattern starts with a bearish (downward) candlestick, indicating the continuation of the existing downtrend.
- Second Candle: The second candle is a small-bodied candle (either bullish or bearish) that reflects market indecision.
- Third Candle: The third candle is a strong bullish (upward) candle that closes well into the body of the first candle. This bullish candle indicates a potential shift in momentum and the beginning of a bullish reversal.
-
The Morning Star is considered a bullish reversal pattern, suggesting that the bears (sellers) are losing control, and the bulls (buyers) are gaining strength.
-
-
-
The Evening Star:
The Evening Star is a multiple candlestick pattern that signals a potential bearish reversal after an uptrend. Here's how it typically forms:
- First Candle: The pattern starts with a bullish (upward) candlestick, indicating the continuation of the existing uptrend.
- Second Candle: The second candle is a small-bodied candle, reflecting market indecision.
- Third Candle: The third candle is a strong bearish (downward) candle that closes well into the body of the first candle. This bearish candle signals a potential shift in momentum and the beginning of a bearish reversal.
-
-
The Evening Star is considered a bearish reversal pattern, suggesting that the bulls (buyers) are losing control, and the bears (sellers) are gaining strength.
-
-
It's important for traders to use these patterns in conjunction with other technical analysis tools and consider the broader market context before making trading decisions. As with any candlestick pattern, false signals can occur, so risk management is crucial.
